Hello DevOps enthusiasts! 👋
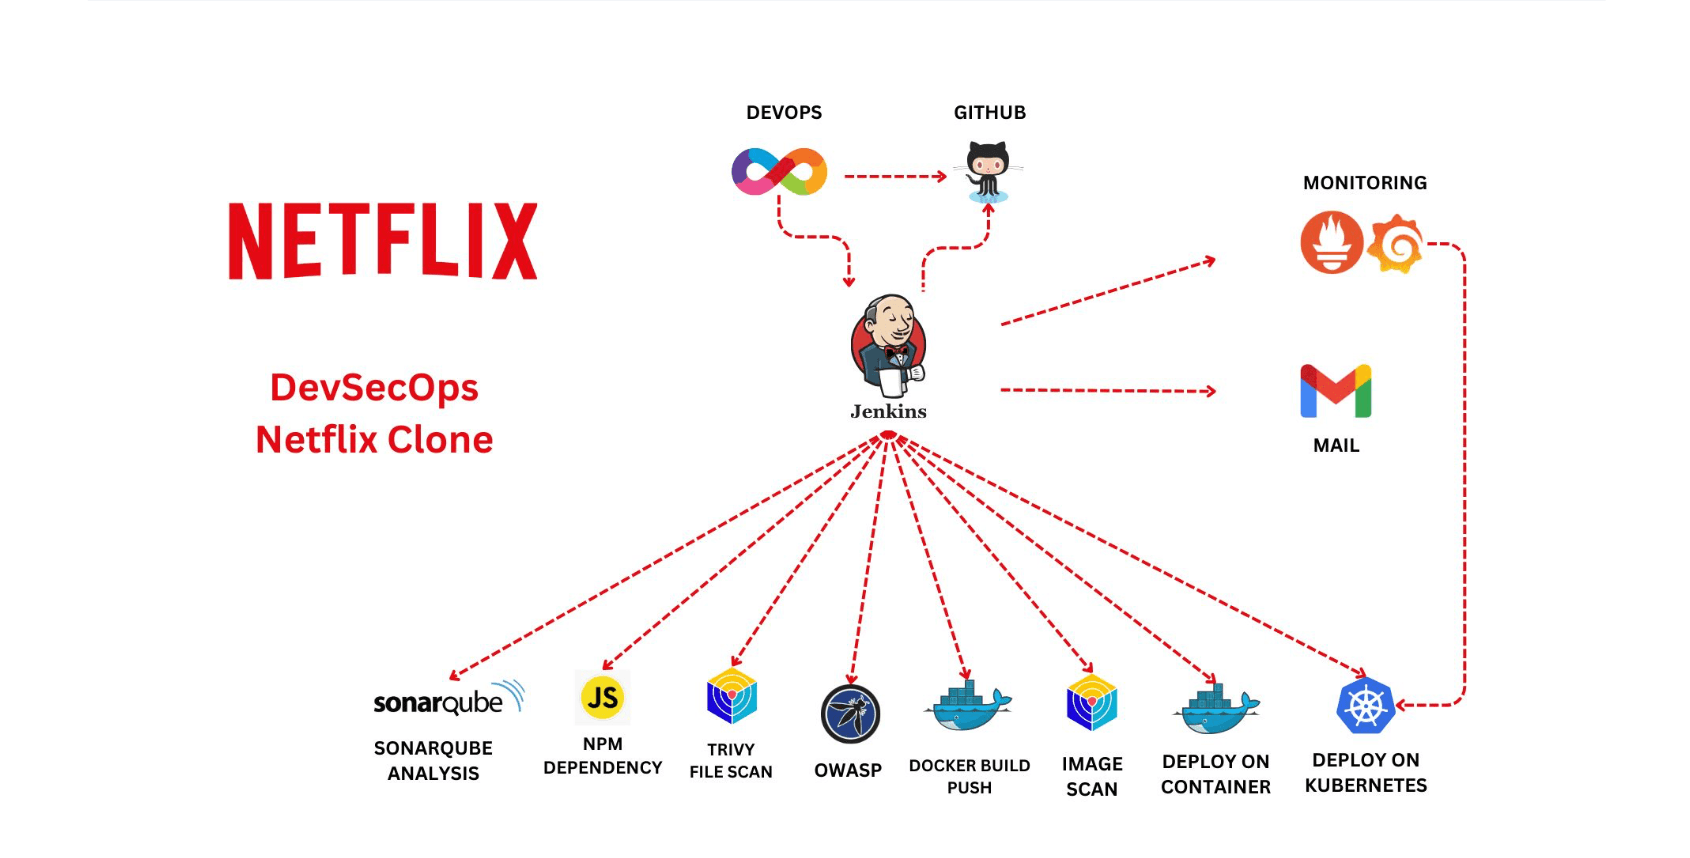
In this project, we'll walk through the deployment of a fully functional Netflix Clone using modern DevOps practices. Our CI/CD pipeline will be built using Jenkins, which will automate the build, test, and deployment processes. The application itself will run inside Docker containers, orchestrated by a Kubernetes cluster for high availability and scalability.
To ensure observability and maintain system health, we’ll integrate Prometheus, Grafana, and Node Exporter to monitor both Jenkins pipelines and Kubernetes metrics in real time.
This blog is a complete, hands-on guide that combines infrastructure automation, containerization, orchestration, and monitoring — everything you'd expect in a real-world DevOps workflow. I hope you find it insightful and valuable!
✅ Step 1 — Launch EC2 Instance
💻 Deploy a T2 Large Ubuntu 22.04 instance on AWS to serve as the base environment.
🛠️ Step 2 — Install Jenkins, Docker & Trivy
⚙️ Set up Jenkins, Docker, and Trivy; then run SonarQube in a Docker container.
🔑 Step 3 — Create TMDB API Key
🔐 Generate an API key from TMDB to fetch movie data for the application.
📊 Step 4 — Install Prometheus & Grafana
📈 Set up Prometheus for monitoring and Grafana for visualizing system metrics.
🔌 Step 5 — Integrate Jenkins with Prometheus
🔗 Install the Prometheus plugin in Jenkins and connect it with the Prometheus server.
✉️ Set up SMTP email integration in Jenkins for real-time build notifications.
📦 Step 7 — Install Essential Jenkins Plugins
🔧 Add plugins for JDK, Node.js, SonarQube Scanner, and OWASP Dependency Check.
🧩 Step 8 — Create Jenkins Declarative Pipeline
📋 Define a declarative pipeline script in Jenkins for CI/CD automation.
🛡️ Step 9 — Set Up OWASP Dependency Check
🔍 Enable OWASP Dependency Check Plugin for vulnerability scanning of dependencies.
🐳 Step 10 — Build & Push Docker Image
📤 Build the Docker image of your app and push it to Docker Hub or another registry.
🚢 Step 11 — Deploy Docker Container
📦 Run the Docker container and expose it to make the app accessible.
☸️ Step 12 — Set Up Kubernetes Cluster
📡 Configure Kubernetes master and worker nodes using Ubuntu 20.04 instances.
🌐 Step 13 — Access the Netflix App
🖥️ Open the app in your browser and verify its functionality and UI.
🔚 Step 14 — Terminate AWS Resources
🛑 Shut down all EC2 instances to avoid unnecessary charges.
🗂️ Implementation Steps
Below is the step-by-step process to implement the entire DevOps pipeline:-
STEP 1: Launch an Ubuntu (22.04) T2 Large Instance
Launch an AWS T2 Large Instance. Use Ubuntu 22.04 as the image. You can create a new key pair or use an existing one. Enable HTTP and HTTPS in the Security Group and open all ports (not recommended for production, but okay for learning purposes).

STEP 2A : Install Jenkins, Docker, and Trivy
- Connect to your console, and enter these commands to Install Jenkins
sudo apt update -y
wget -O - https://packages.adoptium.net/artifactory/api/gpg/key/public | tee /etc/apt/keyrings/adoptium.asc
echo "deb [signed-by=/etc/apt/keyrings/adoptium.asc] https://packages.adoptium.net/artifactory/deb $(awk -F= '/^VERSION_CODENAME/{print$2}' /etc/os-release) main" | tee /etc/apt/sources.list.d/adoptium.list
sudo apt update -y
sudo apt install temurin-17-jdk -y
/usr/bin/java --version
curl -fsSL https://pkg.jenkins.io/debian-stable/jenkins.io-2023.key | sudo tee \
/usr/share/keyrings/jenkins-keyring.asc > /dev/null
echo deb [signed-by=/usr/share/keyrings/jenkins-keyring.asc] \
https://pkg.jenkins.io/debian-stable binary/ | sudo tee \
/etc/apt/sources.list.d/jenkins.list > /dev/null
sudo apt-get update -y
sudo apt-get install jenkins -y
sudo systemctl start jenkins
sudo systemctl status jenkins
vi jenkins.sh
sudo chmod 777 jenkins.sh
./jenkins.sh
Once Jenkins is installed, go to your AWS EC2 Security Group and open Inbound Port 8080, since Jenkins runs on that port.
Now, grab your Public IP Address of the EC2 instance.
You can access Jenkins in your browser using:
<EC2 Public IP Address:8080>
sudo cat /var/lib/jenkins/secrets/initialAdminPassword


Jenkins will now get installed and install all the libraries.

Create a user click on save and continue.
Jenkins Getting Started Screen.

STEP 2B : Install Docker
sudo apt-get update
sudo apt-get install docker.io -y
sudo usermod -aG docker $USER
newgrp docker
sudo chmod 777 /var/run/docker.sock
Once Docker is installed, launch a SonarQube container.
Make sure to open port 9000 in the Security Group, as SonarQube runs on that port.
docker run -d --name sonar -p 9000:9000 sonarqube:lts-community

SonarQube is now successfully up and running.

Log in to SonarQube using the default credentials:
Username: admin

Password: admin
Set your new password.
You will now be redirected to the SonarQube Dashboard.

You will now see the SonarQube Dashboard appear below.

STEP 2C : Install Trivy
vi trivy.sh
sudo apt-get install wget apt-transport-https gnupg lsb-release -y
wget -qO - https://aquasecurity.github.io/trivy-repo/deb/public.key | gpg --dearmor | sudo tee /usr/share/keyrings/trivy.gpg > /dev/null
echo "deb [signed-by=/usr/share/keyrings/trivy.gpg] https://aquasecurity.github.io/trivy-repo/deb $(lsb_release -sc) main" | sudo tee -a /etc/apt/sources.list.d/trivy.list
sudo apt-get update
sudo apt-get install trivy -y
STEP 3 : Generate a TMDB API Key
Now, let's create an API key from The Movie Database (TMDB).
Open a new browser tab and search for “TMDB” to get started.

As soon as you access the TMDB site, you’ll see a page similar to the one shown below.

Click on “Login” at the top-right corner. You’ll be redirected to the login page.
If you don’t have an account, click on “Click here” to sign up.
(Since I already had an account, I simply entered my credentials.)

once you create an account you will see this page.

Let’s create an API key, By clicking on your profile and clicking settings.


Once you navigate to the API section, click on “Create API”.
Fill in the required details, and your API key will be generated — just like shown in the image below.


STEP 4: Install Prometheus and Grafana on a New Server
Begin by creating a dedicated system user for Prometheus.
Using separate users for services improves security and simplifies management.
Run the following command to add the Prometheus user:
sudo useradd \
    --system \
    --no-create-home \
    --shell /bin/false prometheus

--system → Creates a system account.
--no-create-home → Skips creation of a home directory for Prometheus.
--shell /bin/false → Disables shell access for the Prometheus user.
prometheus → Adds a user and group named prometheus.
Let’s check the latest version of Prometheus from the download page.
You can use the curl or wget command to download Prometheus.
wget https://github.com/prometheus/prometheus/releases/download/v2.47.1/prometheus-2.47.1.linux-amd64.tar.gz

Next, extract all Prometheus files from the downloaded archive.
tar -xvf prometheus-2.47.1.linux-amd64.tar.gz

In production, the data directory is usually mounted on a separate disk.
But for this tutorial, we'll simply create a /data directory and a separate folder for Prometheus configuration.
sudo mkdir -p /data /etc/prometheus
Now, let’s change the directory to Prometheus and move some files.
cd prometheus-2.47.1.linux-amd64/

First, move the prometheus binary and promtool to /usr/local/bin/.
promtool is useful for validating configuration files and Prometheus rules.
sudo mv prometheus promtool /usr/local/bin/
Optionally, move the console libraries to the Prometheus configuration directory.
These templates help create custom dashboards using Go templating, but they’re not essential if you're just starting out.
sudo mv consoles/ console_libraries/ /etc/prometheus/
Finally, move the example Prometheus configuration file to the designated config directory.
sudo mv prometheus.yml /etc/prometheus/prometheus.yml
To avoid permission issues, you need to set the correct ownership for the /etc/prometheus/ and data directory.
sudo chown -R prometheus:prometheus /etc/prometheus/ /data/
You can delete the archive and a Prometheus folder when you are done.
cd
rm -rf prometheus-2.47.1.linux-amd64.tar.gz

Verify that the Prometheus binary is executable by running the command below:
prometheus --version

For more details and available configuration options, run the Prometheus help command:
prometheus --help
We'll use some of these options while defining the Prometheus service.
To manage Prometheus as a service, we’ll create a Systemd unit file, since Systemd is the default service manager on most modern Linux distributions.
sudo vim /etc/systemd/system/prometheus.service

Prometheus.service
[Unit]
Description=Prometheus
Wants=network-online.target
After=network-online.target
StartLimitIntervalSec=500
StartLimitBurst=5
[Service]
User=prometheus
Group=prometheus
Type=simple
Restart=on-failure
RestartSec=5s
ExecStart=/usr/local/bin/prometheus \
  --config.file=/etc/prometheus/prometheus.yml \
  --storage.tsdb.path=/data \
  --web.console.templates=/etc/prometheus/consoles \
  --web.console.libraries=/etc/prometheus/console_libraries \
  --web.listen-address=0.0.0.0:9090 \
  --web.enable-lifecycle
[Install]
WantedBy=multi-user.target

Let’s review key Systemd and Prometheus options:
Restart → Defines if the service should restart on failure, timeout, or exit.
RestartSec → Time delay before the service restarts.
User & Group → Specifies which Linux user/group runs the Prometheus process.
--config.file=/etc/prometheus/prometheus.yml → Path to Prometheus's main config file.
--storage.tsdb.path=/data → Directory where Prometheus stores time-series data.
--web.listen-address=0.0.0.0:9090 → Listens on all network interfaces. Use localhost if reverse proxy (e.g., NGINX) is used.
--web.enable-lifecycle → Enables config reload without restarting the Prometheus process.
To ensure Prometheus starts automatically after reboot, run:
Now, simply start the Prometheus service using the command below:
sudo systemctl enable prometheus
sudo systemctl start prometheus
To check the status of Prometheus run the following command:
sudo systemctl status prometheus

If Prometheus fails to start or runs into issues, use the following command to view logs and identify errors:
journalctl -u prometheus -f --no-pager
Now, open your browser and access Prometheus using your server’s IP address.
Make sure to append port 9090, like this:
<public-ip:9090>

If you navigate to the Targets tab in Prometheus, you’ll see a single target — Prometheus itself.
By default, it scrapes its own metrics every 15 seconds.
Install Grafana on Ubuntu 22.04
To visualize system metrics effectively, we can use Grafana a powerful and flexible visualization tool. It supports various data sources, including the widely-used Prometheus.
Before proceeding, let's ensure that all necessary dependencies are installed.
sudo apt-get install -y apt-transport-https software-properties-common
Open your browser and navigate to http://<your-ip>:3000.
Log in to Grafana using the default credentials:
Username: admin
Password: admin

To start visualizing metrics:
In the configuration screen:
Once the data source is connected:
Enter dashboard ID 1860 and click Load
Select your Prometheus data source from the dropdown
Click Import to load the dashboard
✅ You’ll now see a full dashboard with CPU, Memory, Disk, and other system metrics in real time!

Step 5 — Install the Prometheus Plugin and Integrate it with the Prometheus server
🛠️ Let’s Monitor Jenkins System with Prometheus
Ensure Jenkins is up and running on your system.
Go to:
Manage Jenkins → Plugins → Available Plugins
In the search bar, type “Prometheus”
Look for and install the plugin named:
Prometheus Metrics Plugin
This plugin exposes Jenkins metrics at a /prometheus endpoint, which Prometheus can scrape.

No changes needed in the plugin config just click Apply and Save.
To configure Prometheus for Jenkins, create a static target by adding a job_name with static_configs.
Head over to your Prometheus server to update the config.
sudo vim /etc/prometheus/prometheus.yml
- job_name: 'jenkins'
    metrics_path: '/prometheus'
    static_configs:
      - targets: ['<jenkins-ip>:8080']
Prometheus will scrape metrics from the /prometheus endpoint of your Jenkins server.
Replace <jenkins-ip> with your Jenkins host’s IP or DNS name.
Make sure port 8080 is the correct port Jenkins is running on.

Before restarting Prometheus, make sure the configuration file is valid.
If everything is correct, you’ll see:
Checking /etc/prometheus/prometheus.yml → SUCCESS
promtool check config /etc/prometheus/prometheus.yml
🔄 Reload Prometheus Configuration Without Restart
Once the configuration is validated, you can reload it without restarting Prometheus by sending a POST request:
curl -X POST http://localhost:9090/-/reload

To ensure Prometheus is scraping Jenkins metrics correctly, check the Targets section:
Open Prometheus in your browser:
http://<your-prometheus-ip>:9090/targets
Under the “Targets” tab, look for the job named jenkins.
If the status shows “UP”, you're all set! 🎉

📈 Import Jenkins Dashboard in Grafana
For a better visualization of Jenkins metrics, follow these steps to import a pre-built Grafana dashboard:
Go to Grafana Web UI → Click on the “+” (Plus) icon in the left sidebar → Select Import Dashboard
In the dashboard import page:
Once loaded:
✅ You’ll now see a detailed and real-time Jenkins Monitoring Dashboard, showing performance, system usage, and health metrics.

Step 6 — Email Integration With Jenkins and Plugin Setup
📩 Install Email Extension Plugin in Jenkins
To enable advanced email notifications in Jenkins:
Go to Manage Jenkins → Plugins → Available Plugins
Search for Email Extension Plugin
Select it and click on Install without restart
This plugin allows Jenkins to send customizable email alerts for build status and job events.

🔐 Generate Gmail App Password for Jenkins
Open Gmail → Click on profile → Manage your Google Account
Go to Security tab → Enable 2-Step Verification
Scroll down → Click on App Passwords
Verify your password when prompted
Select Other (Custom name) → Enter Jenkins → Click Generate
Copy the 16-character app password shown (e.g., xxxx xxxx xxxx xxxx)
Use this password in Jenkins instead of your Gmail password


Go to Manage Jenkins → Configure System
Scroll down to E-mail Notification section
Enter the following details:
Click on Advanced to expand more options
Choose one of the following setups (depending on your preference):
Option 1: TLS Setup
✅ Use SMTP Authentication
User Name: Your Gmail address
Password: Paste the App Password
✅ Use TLS
SMTP Port: 587
Option 2: SSL Setup
✅ Use SMTP Authentication
User Name: Your Gmail address
Password: Paste the App Password
✅ Use SSL
SMTP Port: 465
(Optional) Set Reply-To Address if needed
Make sure Charset is set to UTF-8
✅ Click on “Test configuration by sending test e-mail” to verify setup
Click Apply and then Save
🔑 Step 2: Add Email Credentials (Alternative Method)
📥 Advanced Email Configuration:
Expand the Advanced section under E-mail Notification
Set Default Content Type to:
HTML (text/html)
→ This ensures formatted emails with HTML structure
Leave List ID and Precedence Header empty unless needed
🚀 Email Extension Plugin Advanced Settings:
Configure the following:
💾 Save the Configuration
- Finally, click on Apply and then Save to persist all changes.
💡 Note: The following script is a part of a Jenkins Declarative Pipeline and should be placed inside your Jenkinsfile.
post {
     always {
        emailext attachLog: true,
            subject: "'${currentBuild.result}'",
            body: "Project: ${env.JOB_NAME}<br/>" +
                "Build Number: ${env.BUILD_NUMBER}<br/>" +
                "URL: ${env.BUILD_URL}<br/>",
            to: 'postbox.aj99@gmail.com',  #change Your mail
            attachmentsPattern: 'trivyfs.txt,trivyimage.txt'
        }
    }
🧱 Step 7 — Install Required Plugins for Pipeline Setup
Before configuring the pipeline, we need to install a few essential plugins in Jenkins to support tools like JDK, SonarQube, Node.js, and Dependency Check.
🔌 7A — Install Required Plugins
Follow these steps to install the necessary plugins:
✅ Once installed, these plugins will allow you to integrate code scanning, JS tools, and JDK inside your pipeline.
Once the required plugins are installed, configure the tools globally so they can be used in your Jenkins pipelines.
Go to Manage Jenkins → Global Tool Configuration
Under the JDK section:
Click on “Add JDK”
Uncheck ✅ Install automatically (if not needed manually)
Provide a name like: jdk17
OR enable auto-install and select Temurin JDK 17
Under the NodeJS section:
Scroll down and click Apply then Save


🧱 7C — Create a Jenkins Pipeline Job
Go to the Jenkins dashboard
Click on “New Item”
Enter the item name as: Netflix
Select Pipeline as the project type
Click OK to create the job
To integrate SonarQube with Jenkins, follow these steps:
Grab the Public IP of your EC2 instance where SonarQube is installed
→ SonarQube runs on port 9000, so open http://<your-public-ip>:9000
Go to your SonarQube Web UI:
Click on Administration → Security → Users
Click on Tokens next to your username
Enter a token name (e.g., jenkins-token)
Click Generate
Copy the generated token and save it somewhere safe — you'll need it in Jenkins

In SonarQube, go to Administration → Security → Users → Tokens, enter a name, and click Generate to create your token.

🔐 Add SonarQube Token in Jenkins
Copy the token generated from SonarQube
Go to Jenkins Dashboard → Manage Jenkins → Credentials
Choose the correct domain (usually (global)), then click Add Credentials
Select Secret Text as the kind
Paste the token into the Secret field
Add an ID like sonar-token and a description (e.g., SonarQube Auth Token)
Click OK to save

Once you click on Create, you will be redirected to the token details page where your token is displayed.

Go to Manage Jenkins → Configure System, scroll to SonarQube servers, click Add, enter a name, SonarQube URL, select the token (by ID), check the injection box, and click Save.

Click on Apply and Save after setting up SonarQube server details.
🔧 Configure System: Used to connect and configure external servers like SonarQube.
🧰 Global Tool Configuration: Used to configure tools installed via plugins (like JDK, NodeJS, Sonar Scanner).
Next, we’ll install the SonarQube Scanner in Global Tool Configuration.

🎯 Add Quality Gate and Webhook in SonarQube
In the SonarQube dashboard, go to Administration → Configuration → Quality Gates
→ Create or select a Quality Gate to enforce code standards.
Then navigate to Administration → Configuration → Webhooks
→ Add a new Webhook to notify Jenkins after analysis is complete.

Click on Create to add the new webhook in SonarQube.

Add a name (e.g., jenkins) and paste the Jenkins webhook URL in the URL field, then click Create.
Go to your Jenkins pipeline job and paste the script inside the Pipeline Script section.
pipeline {
    agent any
    tools {
        jdk 'jdk17'
        nodejs 'node16'
    }
    environment {
        SCANNER_HOME = tool 'sonar-scanner'
    }
    stages {
        stage('clean workspace') {
            steps {
                cleanWs()
            }
        }
        stage('Checkout from Git') {
            steps {
                git branch: 'main', url: 'https://github.com/ApurvGujjar07/Netflix-clone.git'
            }
        }
        stage("Sonarqube Analysis") {
            steps {
                withSonarQubeEnv('sonar-server') {
                    sh ''' $SCANNER_HOME/bin/sonar-scanner -Dsonar.projectName=Netflix \
                    -Dsonar.projectKey=Netflix '''
                }
            }
        }
        stage("quality gate") {
            steps {
                script {
                    waitForQualityGate abortPipeline: false, credentialsId: 'Sonar-token'
                }
            }
        }
        stage('Install Dependencies') {
            steps {
                sh "npm install"
            }
        }
    }
    post {
        always {
            emailext attachLog: true,
                subject: "'${currentBuild.result}'",
                body: "Project: ${env.JOB_NAME}<br/>" +
                      "Build Number: ${env.BUILD_NUMBER}<br/>" +
                      "URL: ${env.BUILD_URL}<br/>",
                to: 'gujjarapurv181@gmail.com',
                attachmentsPattern: 'trivyfs.txt,trivyimage.txt'
        }
    }
}

To view the analysis report, go to your SonarQube Server → Projects, and select your project.

The report is now generated with status "Passed", showing that around 3.2k lines were scanned.
For detailed insights, go to the Issues section in SonarQube.

First, we installed the required plugins. Next, go to Dashboard → Manage Jenkins → Global Tool Configuration to configure the tools like JDK, NodeJS, and Sonar Scanner.

Click on Apply and Save to store the tool configuration.
Now go to your job → Configure → Pipeline, add the updated script, and click Build Now to run it.
stage('OWASP FS SCAN') {
            steps {
                dependencyCheck additionalArguments: '--scan ./ --disableYarnAudit --disableNodeAudit', odcInstallation: 'DP-Check'
                dependencyCheckPublisher pattern: '**/dependency-check-report.xml'
            }
        }
        stage('TRIVY FS SCAN') {
            steps {
                sh "trivy fs . > trivyfs.txt"
            }
        }
The stage view would look like this

Once the build completes, you’ll see a status graph along with any detected vulnerabilities in the SonarQube dashboard.

🐳 Step 8 — Docker Image Build and Push
To build and push Docker images using Jenkins, you need to install a few essential Docker-related plugins.
🔌 Install Required Docker Plugins:
Go to Dashboard → Manage Jenkins → Plugin Manager → Available Plugins
Search and install the following (✅ Install without restart):
Docker
Docker Commons
Docker Pipeline
Docker API
docker-build-step
Now, go to Dashboard → Manage Jenkins → Tools →

🔐 Add DockerHub Credentials in Jenkins
Go to Dashboard → Manage Jenkins → Credentials
Click on the appropriate domain (usually (global)), then click Add Credentials
Choose Username with password as the kind
Fill in:
Username: Your DockerHub username
Password: Your DockerHub password
ID: e.g. dockerhub-creds (you’ll use this in the pipeline)
Click OK to save

stage("Docker Build & Push") {
    steps {
        script {
            withDockerRegistry(credentialsId: 'docker', toolName: 'docker') {
                sh "docker build --build-arg TMDB_V3_API_KEY=Aj7ay86fe14eca3e76869b92 -t netflix ."
                sh "docker tag netflix adgujjar/netflix:latest"
                sh "docker push adgujjar/netflix:latest"
            }
        }
    }
}

stage("TRIVY") {
    steps {
        sh "trivy image adgujjar/netflix:latest > trivyimage.txt"
    }
}
After the build, you'll see the output along with a Dependency-Check trend graph showing vulnerability stats over time.

When you log in to DockerHub, you'll see that a new image has been successfully created and pushed to your repository.

Now, add the following stage to your pipeline to run the container and check if the application is working:
stage("Run Container") {
    steps {
        sh "docker run -d -p 3000:3000 --name netflix-container adgujjar/netflix:latest"
    }
}

Open http://<your-jenkins-public-ip>:8081 in your browser you should see the application running successfully.
☸️ Step 9 — Kubernetes Setup
📝 Note:
1).Kubernetes cluster setup and pod creation can vary based on your environment, cloud provider, and specific project needs.
You can follow the steps as shown above, or adjust them according to your infrastructure.
2).Below, I’m sharing a reference GitHub repo with ready-to-use Kubernetes YAMLs and setup scripts — feel free to use the commands from there as well to complete your setup.
https://github.com/LondheShubham153/kubernetes-in-one-shot(it’s not a promotion link just for your reference .
To deploy your application on Kubernetes, let’s set up a basic 2-node cluster and prepare Jenkins to interact with it.
🖥️ Provision 2 Ubuntu EC2 Instances
⚙️ Install kubectl on Jenkins Server
- Jenkins also needs
kubectl to apply Kubernetes manifests
📥 Run the following commands on your Jenkins EC2 machin
sudo apt update
sudo apt install curl
curl -LO https://dl.k8s.io/release/$(curl -L -s https://dl.k8s.io/release/stable.txt)/bin/linux/amd64/kubectl
sudo install -o root -g root -m 0755 kubectl /usr/local/bin/kubectl
kubectl version --client
🖥️ Part 1 — Master Node (master)
🔹 Set Hostname
sudo hostnamectl set-hostname K8s-Master
🔹 Install Docker and Setup Permissions
sudo apt-get update
sudo apt-get install -y docker.io
sudo usermod -aG docker ubuntu
newgrp docker
sudo chmod 777 /var/run/docker.sock
🔹 Install Kubernetes Components
sudo apt-get install -y apt-transport-https ca-certificates curl gpg

curl -fsSL https://pkgs.k8s.io/core:/stable:/v1.29/deb/Release.key \
| sudo gpg --dearmor -o /etc/apt/keyrings/kubernetes-apt-keyring.gpg

echo 'deb [signed-by=/etc/apt/keyrings/kubernetes-apt-keyring.gpg] https://pkgs.k8s.io/core:/stable:/v1.29/deb/ /' \
| sudo tee /etc/apt/sources.list.d/kubernetes.list

sudo apt-get update
sudo apt-get install -y kubelet kubeadm kubectl
sudo apt-mark hold kubelet kubeadm kubectl
🔹 Initialize the Cluster
sudo kubeadm init --pod-network-cidr=10.244.0.0/16
🔹 Configure kubectl for Current User
mkdir -p $HOME/.kube
sudo cp -i /etc/kubernetes/admin.conf $HOME/.kube/config
sudo chown $(id -u):$(id -g) $HOME/.kube/config
🔹 Apply Flannel CNI
kubectl apply -f https://raw.githubusercontent.com/coreos/flannel/master/Documentation/kube-flannel.yml
📁 Copy the kubeconfig file (/home/ubuntu/.kube/config) to your Jenkins machine, so Jenkins can connect to the cluster.
🖥️ Part 2 — Worker Node (worker)
🔹 Set Hostname
sudo hostnamectl set-hostname K8s-Worker
🔹 Install Kubernetes Components
sudo apt-get install -y apt-transport-https ca-certificates curl gpg

curl -fsSL https://pkgs.k8s.io/core:/stable:/v1.29/deb/Release.key \
| sudo gpg --dearmor -o /etc/apt/keyrings/kubernetes-apt-keyring.gpg

echo 'deb [signed-by=/etc/apt/keyrings/kubernetes-apt-keyring.gpg] https://pkgs.k8s.io/core:/stable:/v1.29/deb/ /' \
| sudo tee /etc/apt/sources.list.d/kubernetes.list

sudo apt-get update
sudo apt-get install -y kubelet kubeadm kubectl
sudo apt-mark hold kubelet kubeadm kubectl
🔹 Join Worker Node to the Cluster
After you run kubeadm init on the master, it will show you a command like:
kubeadm join <master-ip>:6443 --token <token> --discovery-token-ca-cert-hash sha256:<hash>
👉 Copy that full command and run it on the worker node to join the cluster.
Copy the config file to Jenkins master or the local file manager and save it

📝 Note:
This file will be used to configure Kubernetes access in Jenkins using the Kubernetes plugin.

🔐 Add Kubernetes Credentials in Jenkins
Go to Manage Jenkins → Manage Credentials
Click on (global) under Jenkins
Click on Add Credentials
In the Kind dropdown, select: Kubeconfig
Upload the secret-file.txt you saved earlier
Give it an ID like k8s-config and a description
Click OK to save

📊 Install Node Exporter on Kubernetes Master & Worker
To monitor system-level metrics like CPU, memory, and disk, we'll install Node Exporter on both the master and worker nodes.
🔧 Step 1 — Create a System User for Node Exporter
Run the following command on both Master (master) and Worker (worker) nodes:
sudo useradd \
    --system \
    --no-create-home \
    --shell /bin/false node_exporter
📥 Step 2 — Download Node Exporter Binary
Run the following command on both Master and Worker nodes to download Node Exporter:
wget https://github.com/prometheus/node_exporter/releases/download/v1.8.1/node_exporter-1.8.1.linux-amd64.tar.gz
📦 This will download the latest stable version (v1.8.1) of Node Exporter.
tar -xvf node_exporter-1.8.1.linux-amd64.tar.gz
🔹 Move the Binary to /usr/local/bin
sudo mv node_exporter-1.8.1.linux-amd64/node_exporter /usr/local/bin/
🔹 Clean Up the Archive and Folder
rm -rf node_exporter*
🔹 Verify the Binary Runs
node_exporter --version
✅ You should see the Node Exporter version output in the terminal.
Node Exporter supports many plugins (called collectors). You can list all available options using:
node_exporter --help
🧠 For demo purposes, we’ll enable the logind collector using a systemd unit file.
📝 Create a Systemd Service File
Run this on both Master and Worker nodes:
sudo vim /etc/systemd/system/node_exporter.service
[Unit]
Description=Node Exporter
Wants=network-online.target
After=network-online.target
StartLimitIntervalSec=500
StartLimitBurst=5
[Service]
User=node_exporter
Group=node_exporter
Type=simple
Restart=on-failure
RestartSec=5s
ExecStart=/usr/local/bin/node_exporter \
    --collector.logind
[Install]
WantedBy=multi-user.target

Start and Enable Node Exporter Service
After updating the systemd unit file with:
Now run the following commands on both Master and Worker nodes:
✅ Enable Node Exporter to Start on Boot
sudo systemctl enable node_exporter
▶️ Start the Node Exporter Service
sudo systemctl start node_exporter
📊 Check Status of the Service
sudo systemctl status node_exporter
🪵 View Logs (if needed for debugging)
journalctl -u node_exporter -f --no-pager
📝 Tip: Use this log command if Node Exporter fails to start or shows inactive.

At this stage, Prometheus is scraping only a single default target.
Although Prometheus supports dynamic service discovery for platforms like AWS, GCP, and Kubernetes, we’ll keep it simple for now.
🧠 In future tutorials, we’ll explore Prometheus deployments in cloud-native environments and inside Kubernetes clusters.
🛠️ For Now: Add Static Targets Manually
To add a static target (like your Node Exporters), follow these steps:
sudo vim /etc/prometheus/prometheus.yml
- job_name: node_export_masterk8s
    static_configs:
      - targets: ["<master-ip>:9100"]
  - job_name: node_export_workerk8s
    static_configs:
      - targets: ["<worker-ip>:9100"]
By default, Node Exporter will be exposed on port 9100.
Whenever it's not clearly mentioned where to run a command, assume it should be executed on the main instance — i.e., the first EC2 or server where the service (like Prometheus, Jenkins, or Kubernetes Master) was initially set up.
🔁 Reload Prometheus Config Without Restart
Since lifecycle management is enabled, you can reload Prometheus config via API — no need to restart the service or cause downtime.
✅ Validate the Config First
📝 Reminder: Run this on the main Prometheus instance only.
promtool check config /etc/prometheus/prometheus.yml
🔄 Reload Prometheus Configuration via API
Once the config is valid, reload Prometheus without downtime using:
curl -X POST http://localhost:9090/-/reload
✅ This tells Prometheus to re-read the updated config file instantly.
📍 Verify Targets in Prometheus
To confirm that your new targets are being scraped, open:
plaintextCopyEdithttp://<your-prometheus-ip>:9090/targets
✅ If the status shows UP, your Node Exporters are working correctly.

🚀 Final Step — Deploy to Kubernetes from Jenkins
Add the following stage at the end of your Jenkinsfile to automatically deploy the application to your Kubernetes cluster:
stage('Deploy to kubernets'){
            steps{
                script{
                    dir('Kubernetes') {
                        withKubeConfig(caCertificate: '', clusterName: '', contextName: '', credentialsId: 'k8s', namespace: '', restrictKubeConfigAccess: false, serverUrl: '') {
                                sh 'kubectl apply -f deployment.yml'
                                sh 'kubectl apply -f service.yml'
                        }
                    }
                }
            }
        }
📌 Notes:
Make sure you have a Kubernetes folder in your repo containing deployment.yml and service.yml
The credentialsId: 'k8s' should match the Kubernetes secret you created in Jenkins earlier
You can verify deployment with:
✅ Once this stage runs, your app will be live on the Kubernetes cluster! 🚀

🌐 Access Your Application
Open the following URL in your browser to view the deployed app:
http://<public-ip-of-slave>:<service-port>
✅ Output: You should see your Netflix Clone application running in the browser — served directly from your Kubernetes cluster!

Access the Netflix


✅ Complete Jenkins Declarative Pipeline
pipeline {
    agent any

    tools {
        jdk 'jdk17'
        nodejs 'node16'
    }

    environment {
        SCANNER_HOME = tool 'sonar-scanner'
    }

    stages {
        stage('Clean Workspace') {
            steps {
                cleanWs()
            }
        }

        stage('Checkout from Git') {
            steps {
                git branch: 'main', url: 'https://github.com/ApurvGujjar07/Netflix-clone.git'
            }
        }

        stage('SonarQube Analysis') {
            steps {
                withSonarQubeEnv('sonar-server') {
                    sh '''$SCANNER_HOME/bin/sonar-scanner \
                        -Dsonar.projectName=Netflix \
                        -Dsonar.projectKey=Netflix'''
                }
            }
        }

        stage('Quality Gate') {
            steps {
                script {
                    waitForQualityGate abortPipeline: false, credentialsId: 'Sonar-token'
                }
            }
        }

        stage('Install Dependencies') {
            steps {
                sh "npm install"
            }
        }

        stage('OWASP FS Scan') {
            steps {
                dependencyCheck additionalArguments: '--scan ./ --disableYarnAudit --disableNodeAudit', odcInstallation: 'DP-Check'
                dependencyCheckPublisher pattern: '**/dependency-check-report.xml'
            }
        }

        stage('Trivy FS Scan') {
            steps {
                sh "trivy fs . > trivyfs.txt"
            }
        }

        stage('Docker Build & Push') {
            steps {
                script {
                    withDockerRegistry(credentialsId: 'docker', toolName: 'docker') {
                        sh "docker build --build-arg TMDB_V3_API_KEY=AJ7AYe14eca3e76864yah319b92 -t netflix ."
                        sh "docker tag netflix adgujjar/netflix:latest"
                        sh "docker push adgujjar/netflix:latest"
                    }
                }
            }
        }

        stage('Trivy Image Scan') {
            steps {
                sh "trivy image adgujjar/netflix:latest > trivyimage.txt"
            }
        }

        stage('Deploy to Container') {
            steps {
                sh "docker run -d --name netflix -p 8081:80 adgujjar/netflix:latest"
            }
        }

        stage('Deploy to Kubernetes') {
            steps {
                script {
                    dir('Kubernetes') {
                        withKubeConfig(
                            credentialsId: 'k8s',
                            caCertificate: '',
                            clusterName: '',
                            contextName: '',
                            namespace: '',
                            serverUrl: '',
                            restrictKubeConfigAccess: false
                        ) {
                            sh 'kubectl apply -f deployment.yml'
                            sh 'kubectl apply -f service.yml'
                        }
                    }
                }
            }
        }
    }

    post {
        always {
            emailext attachLog: true,
                subject: "'${currentBuild.result}'",
                body: "Project: ${env.JOB_NAME}<br/>" +
                      "Build Number: ${env.BUILD_NUMBER}<br/>" +
                      "URL: ${env.BUILD_URL}<br/>",
                to: 'gujjarapurv181@gmail.com',
                attachmentsPattern: 'trivyfs.txt,trivyimage.txt'
        }
    }
}
Once you're done testing and deploying, make sure to terminate all unused EC2 instances (Jenkins, Kubernetes Master, Worker, SonarQube, etc.) to avoid unnecessary charges.
🙏 Final Note
If you feel I’ve made any mistake in this project or something wasn’t clear, please feel free to leave a comment.
I’ll make sure to reply to your message as soon as possible.
Thank you so much for reading! 🙌
👨💻 About the Author

Hi, I'm Apurv Gujjar, a passionate and aspiring DevOps Engineer.
This project represents the beginning of my professional journey into the world of DevOps, cloud-native technologies, and CI/CD automation.
From writing pipelines and configuring SonarQube to deploying Dockerized applications on Kubernetes — this was more than a technical challenge, it was a learning milestone.
If you're reading this — thank you for being a part of my journey. 🙌
On the right, you’ll see a small glimpse of who's behind the terminal. 👇 (Photo goes here)
📬 Let's Stay Connected
💡 If you found this project useful, or have any suggestions or feedback, feel free to reach out or drop a comment I’d love to connect and improve.
This is just the beginning many more builds, deployments, and learnings ahead.